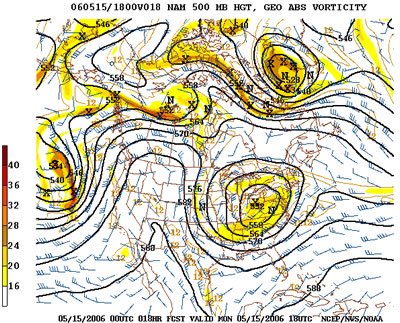
Before the widespread international use of computers the information received at weather centers was decoded and used with other information, such as photographs and other data from weather satellites, to plot synoptic charts. These hand-drawn maps showed isobars and other categories of information in conventional symbols, giving a complete picture of the weather at a particular time.
A team of meteorologists then analyzed the chart and compared it with perhaps six or more charts which depicted conditions over the past day. Air systems and the conditions associated with them were studied to see how they had developed and whether there were signs of any new systems. From this analysis the meteorologists prepared a prognostic chart which summarized their view of future weather conditions. From this chart written forecasts were prepared and issued to the various news media.
 The procedures have been modified to some extent because of the availability of powerful computers based around the world. Today, when the information reaches a weather centre, it is fed into the computer and the weather data is in the form of an internationally-accepted code, information from any part of the world can be used without having to be translated. The computer then produces synoptic charts which not only describe conditions at ground level but also those at several levels (sometimes as many as 15) of the upper air.
Computers can also produce prognostic charts and Numerical Weather Prediction Models by applying the measured quantities of various weather factors (temperatures, air densities, wind velocities and humidity, for example) to formulae based on the physical laws that describe the interaction of these factors. Computer forecasts are reasonably accurate in predicting the behavior of the atmosphere, but are often less successful in predicting the weather 100% accurately. This is chiefly because of the fact that the interactions between air, land and sea are extremely complex, and judgments based on long experience of local peculiarities are still needed for accurate short-term forecasting. For this reason prognostic charts and forecasts are still produced by human hands.